International students come from around the world to study at the University of Georgia. Past years have seen significant changes in the places they call home, though.
Information obtained through University Fact Books dating from 2000 till 2013 suggests that the University has seen its greatest influx of international students from China and India.
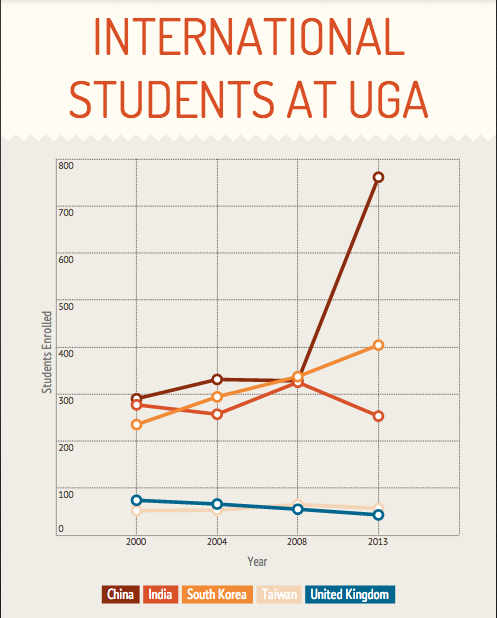
Between 2000 and 2013, for instance, the University saw an approximately 260 percent increase in the number of international students (both graduate and undergraduate) arriving from China. In 2000, the University had 292 Chinese students. In 2013, the same demographic numbered 761.
The number of Indian international students has also increased in past years. Between 2000 and 2008, for instance, the Indian international student population grew from 201 to 325. Since 2008, though, Indian international students have been coming to the University with decreasing frequency. There has been a 22 percent decrease in the number of students from India between 2008 and 2013, at which time the University welcomed 253 Indian students.
Conversely, the number of international students from the United Kingdom has slowly decreased over the years. Since 2000, there has been approximately a 42 percent decrease in the number of students from the United Kingdom.
Significant numbers of international students also come to the University from South Korea and Taiwan, which had 404 students and 57 students study at the University in 2013 respectively.